What Is a Transformer Monitoring System?
A Guide to Load Ratio, Temperature, Harmonics and Alarm Thresholds
Updated: 28.09.2026 · 11 min read
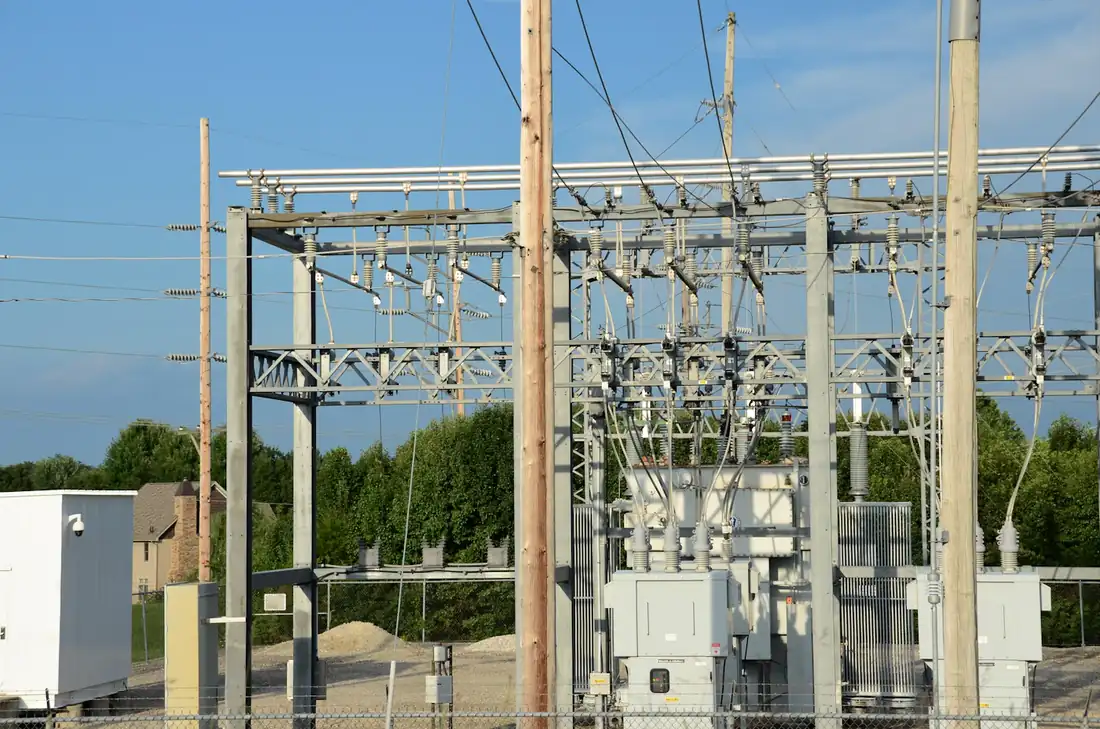
In short: A transformer monitoring system continuously measures and records a power transformer's load ratio (measured kVA / rated kVA), winding or oil temperature, phase current balance and harmonic distortion, and raises a warning when a threshold is exceeded. The data is usually read over Modbus from the power analyzer at the transformer output and from the temperature relay. The goal is to see the overloading and overheating that rapidly age the insulation before they turn into a failure: according to IEC 60076-7, in an oil-immersed transformer the insulation ageing rate doubles for every 6 °C that the hot-spot temperature rises above the 98 °C reference.
Why Is the Power Transformer Critical?
The power transformer is the energy backbone of any industrial or commercial facility. It steps the grid voltage down to the usable level; all electrical equipment is supplied through the transformer. Without a backup supply, a transformer failure means the facility shuts down entirely.
The cost of a transformer failure is not just the price of the equipment: a distribution transformer is often not an off-the-shelf part, so procurement and commissioning can take weeks. During that time production or service is disrupted, and the loss often exceeds the price of the transformer itself.
Most transformers do not fail suddenly but through a slowly accumulating problem: persistently high temperature, extra heating caused by harmonics or unbalanced loading consume the insulation over the years. A transformer monitoring system makes this accumulation visible in numbers.
Which Parameters Are Monitored?
The table below summarises the quantities most often measured in a transformer monitoring project, why they matter and where the data typically comes from.
| Parameter | Why monitor it? | Typical source |
|---|---|---|
| Load ratio (S/Sn), kVA | The main driver of heating and insulation ageing | Power analyzer at the transformer output |
| Phase currents, current imbalance | The most loaded phase heats the winding the most | Power analyzer (L1/L2/L3 currents) |
| Voltage, voltage unbalance | Tap setting, grid problems, motor heating | Power analyzer (phase-neutral, phase-phase) |
| Winding temperature | Directly determines insulation life | Dry-type: PT100 + temperature relay; oil-immersed: winding temperature indicator (thermal image) |
| Top-oil temperature | Overall thermal state of an oil-immersed transformer | Oil thermometer or PT100 |
| THD (current and voltage) | Harmonics cause extra losses and heating | Power analyzer with harmonic measurement |
| Power factor, reactive power | Reactive load wastes the transformer's kVA capacity | Power analyzer |
| Demand and peak | Capacity planning, load growth | Analyzer or monitoring software calculation |
| Dissolved gases (DGA) | Early sign of an internal fault in an oil-immersed transformer | Online DGA monitor or periodic oil analysis |
The core hardware for transformer monitoring already exists in most facilities: a power analyzer in the LV switchboard provides load, voltage, current and (depending on the model) harmonic data, while temperature data comes from the transformer's own temperature relay.
How Is the Load Ratio Calculated?
The load ratio is the ratio of the apparent power the transformer is currently carrying (S, kVA) to its rated power (Sn):
Load ratio (%) = S / Sn × 100 · S = √3 × U × I (U: phase-to-phase voltage, I: phase current)
Example: A 1600 kVA transformer with a 0.4 kV secondary has a rated secondary current of In = 1600 / (1.732 × 0.4) ≈ 2,309 A. If the analyzer measures a line voltage of 400 V and an average phase current of 1,850 A, then S = 1.732 × 0.4 × 1,850 ≈ 1,282 kVA, so the load ratio is ≈ 80%.
The average alone is not enough. If the phase currents at the same moment are 1,750 / 1,850 / 1,950 A, the most loaded phase has reached 84.4% of rated current. Because winding heating is driven by the most loaded phase rather than the average, the thermal assessment should be based on the most loaded phase current.
Keep the following in mind when interpreting it:
- Up to 100% the transformer is operating at its nameplate rating. Loading beyond nameplate rating is defined in IEC 60076-7 and is possible for limited periods; however, the limit is set by temperature and ageing, not by current. That is why the load ratio should be read together with temperature.
- Around 80% is not a standard limit but a practical planning reserve: it is a reminder to run a capacity calculation before adding new loads.
- A persistently very low load ratio is also a finding: the transformer's no-load (core) losses occur every hour regardless of load, so in oversized transformers their share of total consumption grows.
- Monitor demand (e.g. a 15-minute average) and the daily load profile rather than instantaneous values; short peaks such as motor starts do not in themselves mean an overload.
Winding and Oil Temperature: The Parameter That Determines Lifespan
A transformer's life is largely determined by the ageing of its winding insulation (cellulose paper in an oil-immersed transformer), and the main driver of that ageing is temperature. Ageing is fastest at the hottest point, which is why the standards are based on the hot-spot temperature.
- IEC 60076-7: For non-thermally upgraded paper the reference hot-spot temperature is 98 °C, and the relative ageing rate is calculated as V = 2(θh − 98)/6. In other words, every 6 °C increase doubles the ageing rate: 2 times at 104 °C, 4 times at 110 °C, 8 times at 116 °C, and half the rate at 92 °C.
- IEEE C57.91: For transformers with a 65 °C average winding rise and thermally upgraded paper the reference is 110 °C (80 °C hot-spot rise + 30 °C average ambient). According to the standard's Arrhenius-based formula, an increase of about 7 °C in this range doubles the ageing rate.
- Limits: For distribution transformers, IEC 60076-7 limits the hot-spot temperature to 120 °C under normal cyclic loading and 140 °C under long-time emergency loading. IEEE C57.91 notes that hot-spot temperatures above 140 °C may cause gassing in the solid insulation and the oil.
In most transformers the hot spot is not measured directly. In oil-immersed transformers the winding temperature indicator estimates it by adding a load-current-proportional thermal gradient to the top-oil temperature (thermal image); for direct measurement, fibre-optic probes are installed in the winding. In dry-type transformers a PT100 sensor is usually installed in the LV winding of each phase and connected to a temperature relay.
Ambient temperature is also part of the equation. IEC 60076-1 standard conditions define the cooling air as 40 °C at any time, 30 °C as the monthly average of the hottest month and 20 °C as the yearly average. A poorly ventilated transformer room makes the winding run hotter at the same load, so measuring the room temperature is also useful. For practical steps to reduce temperature, see our guide to extending transformer life.
Harmonics and the K-Factor
Non-linear loads such as frequency converters, UPS systems, LED drivers and IT equipment draw non-sinusoidal current. According to IEEE C57.110, winding eddy-current losses increase in proportion to the square of each harmonic current multiplied by the square of its harmonic order. The result: at the same kVA, the transformer runs hotter than with a harmonic-free load.
- IEEE C57.12.00 defines the usual service condition of a standard transformer as a load current harmonic factor of no more than 0.05 pu (5%). Above that, the transformer's capability is assessed with derating according to the IEEE C57.110 method.
- Facilities with heavy harmonic loads use K-factor transformers: K = Σ(Ih² × h²) / Σ(Ih²). K-factor ratings are defined in UL 1561.
- Third-order (triplen) harmonics add up in the neutral conductor; in delta-wye connected transformers (e.g. Dyn) they circulate in the delta winding and cause extra heating. Monitoring the neutral current is therefore important.
- Reference on the voltage side: EN 50160 and IEEE 519 limit total voltage harmonic distortion (THDv) to 8% for systems of 1 kV and below.
For the sources of harmonics and filtering methods, see our article what is harmonic distortion, and for continuous measurement, the power quality monitoring solution.
Phase Imbalance
In facilities where single-phase loads are not distributed evenly across the phases, one phase carries noticeably more load than the others. This heats the winding of the most loaded phase more and increases the neutral current. In practice, current imbalance is calculated as the largest deviation divided by the average: in the example above, (1,950 − 1,850) / 1,850 ≈ 5.4%.
Voltage unbalance, on the other hand, usually originates from the grid and mainly heats three-phase motors. According to EN 50160, under normal operating conditions, 95% of the 10-minute mean values over each one-week period of the ratio of the negative-sequence component to the positive-sequence component of the voltage shall be within 0–2%.
Monitoring Differences Between Oil-Immersed and Dry-Type Transformers
| Topic | Oil-immersed transformer | Dry-type (cast resin) |
|---|---|---|
| Temperature measurement | Top-oil thermometer, winding temperature indicator (thermal image) | PT100 in the LV winding of each phase, temperature relay |
| Thermal reference | Paper-oil insulation; IEC 60076-7 ageing model | Insulation system class: F (155 °C), H (180 °C) |
| Mechanical / gas protection | Buchholz relay on conservator types; gas-pressure-temperature-level protection relay on hermetically sealed types | No gas protection; dust, humidity and ventilation are critical |
| Cooling | Natural oil/air (ONAN) or with fans (ONAF) | Natural air (AN) or fans switched on by the temperature relay (AF) |
| Advanced diagnostics | Dissolved gas analysis (DGA), oil moisture and dielectric tests | Partial discharge measurement, thermal camera |
Online DGA: An Advanced Option
In oil-immersed transformers, internal faults produce gases that dissolve in the oil, and the type of gas reveals the type of fault: hydrogen (H₂) points to partial discharge; methane and ethane to low-temperature overheating; ethylene to high-temperature overheating; acetylene (C₂H₂) to arcing; and carbon monoxide and carbon dioxide to degradation of the paper insulation. Interpretation methods are defined in IEC 60599 (e.g. the Duval triangle, gas ratios) and IEEE C57.104.
For distribution transformers, DGA is usually performed in a laboratory on periodic oil samples. Online DGA monitors measure the gases continuously and are mostly chosen for large power transformers or critical facilities that cannot tolerate an outage. Data from monitors with a communication output can be evaluated on the same screen as the load and temperature trends.
Alarm Thresholds: A Starting Point
The values below are a starting point and must be adjusted to the manufacturer's data. The transformer's nameplate, test report and the manufacturer's protection settings always take precedence; this table does not replace the trip settings of the protection relay.
| Parameter | Warning | Alarm | Basis |
|---|---|---|---|
| Load ratio (demand average) | 80% | 100% | Nameplate rating; 80% planning reserve |
| Most loaded phase current | 90% In | 100% In | Rated secondary current |
| Dry-type, class F winding (PT100) | 140 °C | 150 °C | Example from a manufacturer catalogue for class F cast resin transformers |
| Oil-immersed, top oil | 85 °C | 95 °C | Common oil thermometer settings |
| Oil-immersed, winding (thermal image) | 105 °C | 115 °C | Below the IEC 60076-7 normal cyclic hot-spot limit of 120 °C |
| Voltage THD (LV) | 5% | 8% | EN 50160 / IEEE 519: 8% |
| Current harmonic distortion (near rated load) | 5% | — | IEEE C57.12.00: above 5%, review derating |
| Voltage unbalance | 1% | 2% | EN 50160: 2% |
To reduce nuisance alarms, add a short delay or hysteresis to the thresholds; do not treat a current THD value that looks high in percentage terms at low load as a reason for an alarm on its own.
How Does a Transformer Monitoring System Work?
Modern transformer monitoring systems read data from the power analyzer and the temperature relay using the Modbus TCP/RTU protocol. Schneider PM5xxx, Siemens SENTRON PAC and ABB B-series power analyzers are widely used for this purpose.
In Argus EMS, the on-site Field Agent reads these devices periodically and transmits the data to the central server over TLS-encrypted MQTT. If the connection drops, readings are buffered locally on site and sent when the connection returns. On the server side the data is processed, shown in trend charts, and an email alarm is generated when defined thresholds are exceeded.
Commissioning Checklist
- Nameplate data: Have the rated power (Sn), primary/secondary voltage, short-circuit impedance (uk %), vector group (e.g. Dyn11), cooling type and insulation class been recorded?
- Current transformer ratio: Does the ratio in the analyzer match the current transformer on site; is the measured kVA consistent with the expected load?
- Polarity and phase sequence: If active power appears negative, the current transformer polarity or phase mapping is wrong; it is corrected on site, not hidden in software.
- Temperature relay: Have the communication address, register map and PT100 channel-to-phase mapping been verified; has the reading been compared with the relay display?
- Time synchronisation: Are the clocks of the analyzer, relay and data collection device correct?
- Thresholds: Have the manufacturer's values been entered and has the email for a test alarm been received?
- Baseline profile: Has the first week's load curve and load-temperature relationship been recorded as a baseline for later deviations?
- Communication outage test: When the connection is briefly interrupted, has it been verified that the local buffer empties once it returns?
Which Facilities Should Monitor Their Transformers?
As a rule, we can say this: if the cost of the operation that a transformer failure would halt is higher than the cost of the monitoring system, then monitoring is necessary.
- Hospitals and healthcare facilities: A transformer outage affects surgery, intensive care and critical medical equipment.
- Industrial manufacturing: A production line stoppage can cause losses far greater than the price of the transformer itself.
- Data centers and telecommunications: High availability targets and the harmonics generated by dense UPS/IT loads make continuous monitoring necessary in practice.
- Shopping malls and commercial buildings: Uninterrupted operation is critical for customer experience and tenant satisfaction.
Argus EMS Transformer Module
Argus EMS builds transformer monitoring on top of your existing metering infrastructure. Key features:
- Reads transformer power analyzers and temperature relays over Modbus TCP/RTU via the Field Agent
- TLS-encrypted MQTT transmission; local buffering on site during connection outages
- Load ratio, kVA and demand trends
- Harmonic (THD) and phase imbalance trends where the analyzer provides them
- Email alarms when thresholds are exceeded
- Single-dashboard monitoring for multi-site portfolios
For installation scope and supported devices, see the transformer monitoring solution page.
Monitor Your Transformers with Argus
Test it with your own facility data in a demo session.